Buying and Selling Smoothed with HistogramBuying and Selling Smoothed with Histogram
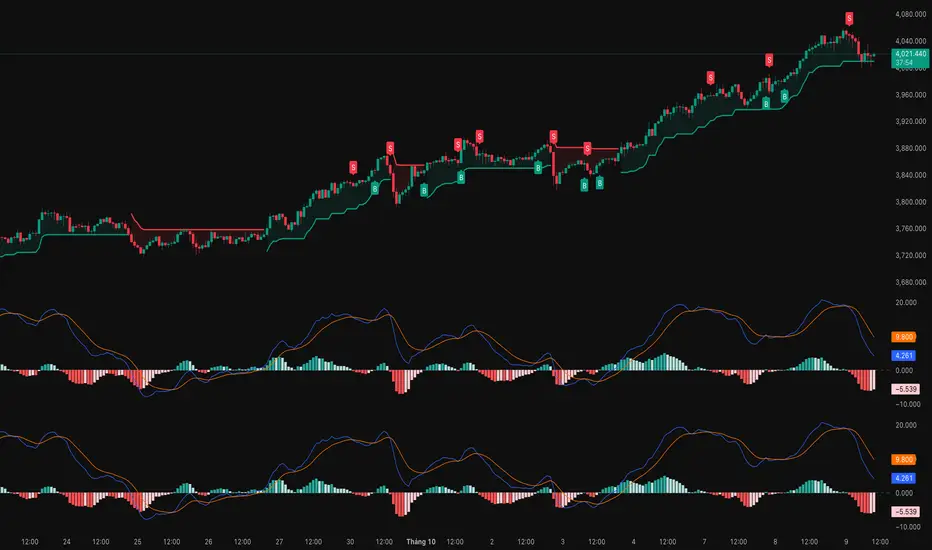
Smoothed version with version with a red line representing the selling pressure and a green line which represents the Buying pressure.
If the green line is above the red line it would mean that the Buying pressure is more and vice versa.
The difference between the two is plotted as a Histogram. This is a cumulative value of the buying and selling pressure and provides a easy visual presentation of the dominating pressure.
ابحث في النصوص البرمجية عن "Buy sell"

Volume Profile Free Ultra SLI (100 Levels Value Area VWAP) - RRBVolume Profile Free Ultra SLI by RagingRocketBull 2019
Version 1.0
This indicator calculates Volume Profile for a given range and shows it as a histogram consisting of 100 horizontal bars.
This is basically the MAX SLI version with +50 more Pinescript v4 line objects added as levels.
It can also show Point of Control (POC), Developing POC, Value Area/VWAP StdDev High/Low as dynamically moving levels.
Free accounts can't access Standard TradingView Volume Profile, hence this indicator.
There are several versions: Free Pro, Free MAX SLI, Free Ultra SLI, Free History. This is the Free Ultra SLI version. The Differences are listed below:
- Free Pro: 25 levels, +Developing POC, Value Area/VWAP High/Low Levels, Above/Below Area Dimming
- Free MAX SLI: 50 levels, 2x SLI modes for Buy/Sell or even higher res 150 levels
- Free Ultra SLI: 100 levels, packed to the limit, 2x SLI modes for Buy/Sell or even higher res 300 levels
- Free History: auto highest/lowest, historic poc/va levels for each session
Features:
- High-Res Volume Profile with up to 100 levels (line implementation)
- 2x SLI modes for even higher res: 300 levels with 3x vertical SLI, 100 buy/sell levels with 2x horiz SLI
- Calculate Volume Profile on full history
- POC, Developing POC Levels
- Buy/Sell/Total volume modes
- Side Cover
- Value Area, VAH/VAL dynamic levels
- VWAP High/Low dynamic levels with Source, Length, StdDev as params
- Show/Hide all levels
- Dim Non Value Area Zones
- Custom Range with Highlighting
- 3 Anchor points for Volume Profile
- Flip Levels Horizontally
- Adjustable width, offset and spacing of levels
- Custom Color for POC/VA/VWAP levels, Transparency for buy/sell levels
WARNING:
- Compilation Time: 1 min 20 sec
Usage:
- specify max_level/min_level/spacing (required)
- select range (start_bar, range length), confirm with range highlighting
- select volume type: Buy/Sell/Total
- select mode Value Area/VWAP to show corresponding levels
- flip/select anchor point to position the buy/sell levels
- use Horiz Buy/Sell SLI mode with 100 or Vertical SLI with 300 levels if needed
- use POC/Developing POC/VA/VWAP High/Low as S/R levels. Usually daily values from 1-3 days back are used as levels for the current day.
SLI:
use SLI modes to extend the functionality of the indicator:
- Horiz Buy/Sell 2x SLI lets you view 100 Buy/Sell Levels at the same time
- Vertical Max_Vol 3x SLI lets you increase the resolution to 300 levels
- you need at least 2 instances of the indicator attached to the same chart for SLI to work
1) Enable Horiz SLI:
- attach 2 indicator instances to the chart
- make sure all instances have the same min_level/max_level/range/spacing settings
- select volume type for each instance: you can have a buy/sell or buy/total or sell/total SLI. Make sure your buy volume instance is the last attached to be displayed on top of sell/total instances without overlapping.
- set buy_sell_sli_mode to true for indicator instances with volume_type = buy/sell, for type total this is optional.
- this basically tells the script to calculate % lengths based on total volume instead of individual buy/sell volumes and use ext offset for sell levels
- Sell Offset is calculated relative to Buy Offset to stack/extend sell after buy. Buy Offset = Zero - Buy Length. Sell Offset = Buy Offset - Sell Length = Zero - Buy Length - Sell Length
- there are no master/slave instances in this mode, all indicators are equal, poc/va levels are not affected and can work independently, i.e. one instance can show va levels, another - vwap.
2) Enable Vertical SLI:
- attach the first instance and evaluate the full range to roughly determine where is the highest max_vol/poc level i.e. 0..20000, poc is in the bottom half (third, middle etc) or
- add more instances and split the full vertical range between them, i.e. set min_level/max_level of each corresponding instance to 0..10000, 10000..20000 etc
- make sure all instances have the same range/spacing settings
- an instance with a subrange containing the poc level of the full range is now your master instance (bottom half). All other instances are slaves, their levels will be calculated based on the max_vol/poc of the master instance instead of local values
- set show_max_vol_sli to true for the master instance. for slave instances this is optional and can be used to check if master/slave max_vol values match and slave can read the master's value. This simply plots the max_vol value
- you can also attach all instances and set show_max_vol_sli to true in all of them - the instance with the largest max_vol should become the master
Auto/Manual Ext Max_Vol Modes:
- for auto vertical max_vol SLI mode set max_vol_sli_src in all slave instances to the max_vol of the master indicator: "VolumeProfileFree_MAX_RRB: Max Volume for Vertical SLI Mode". It can be tricky with 2+ instances
- in case auto SLI mode doesn't work - assign max_vol_sli_ext in all slave instances the max_vol value of the master indicator manually and repeat on each change
- manual override max_vol_sli_ext has higher priority than auto max_vol_sli_src when both values are assigned, when they are 0 and close respectively - SLI is disabled
- master/slave max_vol values must match on each bar at all times to maintain proper level scale, otherwise slave's levels will look larger than they should relative to the master's levels.
- Max_vol (red) is the last param in the long list of indicator outputs
- the only true max_vol/poc in this SLI mode is the master's max_vol/poc. All poc/va levels in slaves will be irrelevant and are disabled automatically. Slaves can only show VWAP levels.
- VA Levels of the master instance in this SLI mode are calculated based on the subrange, not the whole range and may be inaccurate. Cross check with the full range.
WARNING!
- auto mode max_vol_sli_src is experimental and may not work as expected
- you can only assign auto mode max_vol_sli_src = max_vol once due to some bug with unhandled exception/buffer overflow in Tradingview. Seems that you can clear the value only by removing the indicator instance
- sometimes you may see a "study in error state" error when attempting to set it back to close. Remove indicator/Reload chart and start from scratch
- volume profile may not finish to redraw and freeze in an ugly shape after an UI parameter change when max_vol_sli_src is assigned a max_vol value. Assign it to close - VP should redraw properly, but it may not clear the assigned max_vol value
- you can't seem to be able to assign a proper auto max_vol value to the 3rd slave instance
- 2x Vertical SLI works and tested in both auto/manual, 3x SLI - only manual seems to work (you can have a mixed mode: 2nd instance - auto, 3rd - manual)
Notes:
- This code uses Pinescript v3 compatibility framework
- This code is 20x-30x faster (main for cycle is removed) especially on lower tfs with long history - only 4-5 sec load/redraw time vs 30-60 sec of the old Pro versions
- Instead of repeatedly calculating the total sum of volumes for the whole range on each bar, vol sums are now increased on each bar and passed to the next in the range making it a per range vs per bar calculation that reduces time dramatically
- 100 levels consist of 50 main plot levels and 50 line objects used as alternate levels, differences are:
- line objects are always shown on top of other objects, such as plot levels, zero line and side cover, it's not possible to cover/move them below.
- all line objects have variable lengths, use actual x,y coords and don't need side cover, while all plot levels have a fixed length of 100 bars, use offset and require cover.
- all key properties of line objects, such as x,y coords, color can be modified, objects can be moved/deleted, while this is not possible for static plot levels.
- large width values cause line objects to expand only up/down from center while their length remains the same and stays within the level's start/end points similar to an area style.
- large width values make plot levels expand in all directions (both h/v), beyond level start/end points, sometimes overlapping zero line, making them an inaccurate % length representation, as opposed to line objects/plot levels with area style.
- large width values translate into different widths on screen for line objects and plot levels.
- you can't compensate for this unwanted horiz width expansion of plot levels because width uses its own units, that don't translate into bars/pixels.
- line objects are visible only when num_levels > 50, plot levels are used otherwise
- Since line objects are lines, plot levels also use style line because other style implementations will break the symmetry/spacing between levels.
- if you don't see a volume profile check range settings: min_level/max_level and spacing, set spacing to 0 (or adjust accordingly based on the symbol's precision, i.e. 0.00001)
- you can view either of Buy/Sell/Total volumes, but you can't display Buy/Sell levels at the same time using a single instance (this would 2x reduce the number of levels). Use 2 indicator instances in horiz buy/sell sli mode for that.
- Volume Profile/Value Area are calculated for a given range and updated on each bar. Each level has a fixed length. Offsets control visible level parts. Side Cover hides the invisible parts.
- Custom Color for POC/VA/VWAP levels - UI Style color/transparency can only change shape's color and doesn't affect textcolor, hence this additional option
- Custom Width - UI Style supports only width <= 4, hence this additional option
- POC is visible in both modes. In VWAP mode Developing POC becomes VWAP, VA High and Low => VWAP High and Low correspondingly to minimize the number of plot outputs
- You can't change buy/sell level colors from input (only transparency) - this requires 2x plot outputs => 2x reduces the number of levels to fit the max 64 limit. That's why 2 additional plots are used to dim the non Value Area zones
- You can change level transparency of line objects. Due to Pinescript limitations, only discrete values are supported.
- Inverse transp correlation creates the necessary illusion of "covered" line objects, although they are shown on top of the cover all the time
- If custom lines_transp is set the illusion will break because transp range can't be skewed easily (i.e. transp 0..100 is always mapped to 100..0 and can't be mapped to 50..0)
- transparency can applied to lines dynamically but nva top zone can't be completely removed because plot/mixed type of levels are still used when num_levels < 50 and require cover
- transparency can't be applied to plot levels dynamically from script this can be done only once from UI, and you can't change plot color for the past length bars
- All buy/sell volume lengths are calculated as % of a fixed base width = 100 bars (100%). You can't set show_last from input to change it
- Range selection/Anchoring is not accurate on charts with time gaps since you can only anchor from a point in the future and measure distance in time periods, not actual bars, and there's no way of knowing the number of future gaps in advance.
- Adjust Width for Log Scale mode now also works on high precision charts with small prices (i.e. 0.00001)
- in Adjust Width for Log Scale mode Level1 width extremes can be capped using max deviation (when level1 = 0, shift = 0 width becomes infinite)
- There's no such thing as buy/sell volume, there's just volume, but for the purposes of the Volume Profile method, assume: bull candle = buy volume, bear candle = sell volume
P.S. I am your grandfather, Luke! Now, join the Dark Side in your father's steps or be destroyed! Once more the Sith will rule the Galaxy, and we shall have peace...

Volume Profile Free MAX SLI (50 Levels Value Area VWAP) by RRBVolume Profile Free MAX SLI by RagingRocketBull 2019
Version 1.0
All available Volume Profile Free MAX SLI versions are listed below (They are very similar and I don't want to publish them as separate indicators):
ver 1.0: style columns implementation
ver 2.0: style histogram implementation
ver 3.0: style line implementation
This indicator calculates Volume Profile for a given range and shows it as a histogram consisting of 50 horizontal bars.
It can also show Point of Control (POC), Developing POC, Value Area/VWAP StdDev High/Low as dynamically moving levels.
Free accounts can't access Standard TradingView Volume Profile, hence this indicator.
There are several versions: Free Pro, Free MAX SLI, Free History. This is the Free MAX SLI version. The Differences are listed below:
- Free Pro: 25 levels, +Developing POC, Value Area/VWAP High/Low Levels, Above/Below Area Dimming
- Free MAX SLI: 50 levels, packed to the limit, 2x SLI modes for Buy/Sell or even higher res 150 levels
- Free History: auto highest/lowest, historic poc/va levels for each session
Features:
- High-Res Volume Profile with up to 50 levels (3 implementations)
- 20-30x faster than the old Pro versions especially on lower tfs with long history
- 2x SLI modes for even higher res: 150 levels with 3x vertical SLI, 50 buy/sell levels with 2x horiz SLI
- Calculate Volume Profile on full history
- POC, Developing POC Levels
- Buy/Sell/Total volume modes
- Side Cover
- Value Area, VAH/VAL dynamic levels
- VWAP High/Low dynamic levels with Source, Length, StdDev as params
- Show/Hide all levels
- Dim Non Value Area Zones
- Custom Range with Highlighting
- 3 Anchor points for Volume Profile
- Flip Levels Horizontally
- Adjustable width, offset and spacing of levels
- Custom Color for POC/VA/VWAP levels and Transparency for buy/sell levels
Usage:
- specify max_level/min_level/spacing (required)
- select range (start_bar, range length), confirm with range highlighting
- select volume type: Buy/Sell/Total
- select mode Value Area/VWAP to show corresponding levels
- flip/select anchor point to position the buy/sell levels
- use Horiz SLI mode for 50 Buy/Sell or Vertical SLI for 150 levels if needed
- use POC/Developing POC/VA/VWAP High/Low as S/R levels. Usually daily values from 1-3 days back are used as levels for the current day.
SLI:
- use SLI modes to extend the functionality of the indicator:
- Horiz Buy/Sell 2x SLI lets you view 50 Buy/Sell Levels at the same time
- Vertical Max_Vol 3x SLI lets you increase the resolution to 150 levels
- you need at least 2 instances of the indicator attached to the same chart for SLI to work
1) Enable Horiz SLI:
- attach 2 indicator instances to the chart
- make sure all instances have the same min_level/max_level/range/spacing settings
- select volume type for each instance: you can have a buy/sell or buy/total or sell/total SLI. Make sure your buy volume instance is the last attached to be displayed on top of sell/total instances without overlapping.
- set buy_sell_sli_mode to true for indicator instances with volume_type = buy/sell, for type total this is optional.
- this basically tells the script to calculate % lengths based on total volume instead of individual buy/sell volumes and use ext offset for sell levels
- Sell Offset is calculated relative to Buy Offset to stack/extend sell after buy. Buy Offset = Zero - Buy Length. Sell Offset = Buy Offset - Sell Length = Zero - Buy Length - Sell Length
- there are no master/slave instances in this mode, all indicators are equal, poc/va levels are not affected and can work independently, i.e. one instance can show va levels, another - vwap.
2) Enable Vertical SLI:
- attach the first instance and evaluate the full range to roughly determine where is the highest max_vol/poc level i.e. 0..20000, poc is in the bottom half (third, middle etc) or
- add more instances and split the full vertical range between them, i.e. set min_level/max_level of each corresponding instance to 0..10000, 10000..20000 etc
- make sure all instances have the same range/spacing settings
- an instance with a subrange containing the poc level of the full range is now your master instance (bottom half). All other instances are slaves, their levels will be calculated based on the max_vol/poc of the master instance instead of local values
- set show_max_vol_sli to true for the master instance. for slave instances this is optional and can be used to check if master/slave max_vol values match and slave can read the master's value. This simply plots the max_vol value
- you can also attach all instances and set show_max_vol_sli to true in all of them - the instance with the largest max_vol should become the master
Auto/Manual Ext Max_Vol Modes:
- for auto vertical max_vol SLI mode set max_vol_sli_src in all slave instances to the max_vol of the master indicator: "VolumeProfileFree_MAX_RRB: Max Volume for Vertical SLI Mode". It can be tricky with 2+ instances
- in case auto SLI mode doesn't work - assign max_vol_sli_ext in all slave instances the max_vol value of the master indicator manually and repeat on each change
- manual override max_vol_sli_ext has higher priority than auto max_vol_sli_src when both values are assigned, when they are 0 and close respectively - SLI is disabled
- master/slave max_vol values must match on each bar at all times to maintain proper level scale, otherwise slave's levels will look larger than they should relative to the master's levels.
- Max_vol (red) is the last param in the long list of indicator outputs
- the only true max_vol/poc in this SLI mode is the master's max_vol/poc. All poc/va levels in slaves will be irrelevant and are disabled automatically. Slaves can only show VWAP levels.
- VA Levels of the master instance in this SLI mode are calculated based on the subrange, not the whole range. Cross check with the full range.
WARNING!
- auto mode max_vol_sli_src is experimental and may not work as expected
- you can only assign auto mode max_vol_sli_src = max_vol once due to some bug with unhandled exception/buffer overflow in Tradingview. Seems that you can clear the value only by removing the indicator instance
- sometimes you may see a "study in error state" error when attempting to set it back to close. Remove indicator/Reload chart and start from scratch
- volume profile may not finish to redraw and freeze in an ugly shape after an UI parameter change when max_vol_sli_src is assigned a max_vol value. Assign it to close - VP should redraw properly, but it may not clear the assigned max_vol value
- you can't seem to be able to assign a proper auto max_vol value to the 3rd slave instance
- 2x Vertical SLI works and tested in both auto/manual, 3x SLI - only manual seems to work
Notes:
- This code is 20x-30x faster (main for cycle is removed) especially on lower tfs with long history - only 2-3 sec load/redraw time vs 30-60 sec of the old Pro versions
- Instead of repeatedly calculating the total sum of volumes for the whole range on each bar, vol sums are now increased on each bar and passed to the next in the range making it a per range vs per bar calculation that reduces time dramatically
- hist_base for levels still results is ugly redraw
- if you don't see a volume profile check range settings: min_level/max_level and spacing, set spacing to 0 (or adjust accordingly based on the symbol's precision, i.e. 0.00001)
- you can view either of Buy/Sell/Total volumes, but you can't display Buy/Sell levels at the same time using a single instance (this would 2x reduce the number of levels). Use 2 indicator instances in horiz buy/sell sli mode for that.
- Volume Profile/Value Area are calculated for a given range and updated on each bar. Each level has a fixed length. Offsets control visible level parts. Side Cover hides the invisible parts.
- Custom Color for POC/VA/VWAP levels - UI Style color/transparency can only change shape's color and doesn't affect textcolor, hence this additional option
- Custom Width - UI Style supports only width <= 4, hence this additional option
- POC is visible in both modes. In VWAP mode Developing POC becomes VWAP, VA High and Low => VWAP High and Low correspondingly to minimize the number of plot outputs
- You can't change buy/sell level colors from input (only plot transparency) - this requires 2x plot outputs => 2x reduces the number of levels to fit the max 64 limit. That's why 2 additional plots are used to dim the non Value Area zones
- All buy/sell volume lengths are calculated as % of a fixed base width = 100 bars (100%). You can't set show_last from input to change it
- There's no such thing as buy/sell volume, there's just volume, but for the purposes of the Volume Profile method, assume: bull candle = buy volume, bear candle = sell volume
P.S. Gravitonium Levels Are Increasing. Unobtainium is nowhere to be found!
Links on Volume Profile and Value Area calculation and usage:
www.tradingview.com
stockcharts.com
onlinelibrary.wiley.com

Volume Profile Free Pro (25 Levels Value Area VWAP) by RRBVolume Profile Free Pro by RagingRocketBull 2019
Version 1.0
All available Volume Profile Free Pro versions are listed below (They are very similar and I don't want to publish them as separate indicators):
ver 1.0: style columns implementation
ver 2.0: style histogram implementation
ver 3.0: style line implementation
This indicator calculates Volume Profile for a given range and shows it as a histogram consisting of 25 horizontal bars.
It can also show Point of Control (POC), Developing POC, Value Area/VWAP StdDev High/Low as dynamically moving levels.
Free accounts can't access Standard TradingView Volume Profile, hence this indicator.
There are 3 basic methods to calculate the Value Area for a session.
- original method developed by Steidlmayr (calculated around POC)
- classical method using StdDev (calculated around the mean VWAP)
- another method based on the mean absolute deviation (calculated around the median)
POC is a high volume node and can be used as support/resistance. But when far from the day's average price it may not be as good a trend filter as the other methods.
The 80% Rule: When the market opens above/below the Value Area and then returns/stays back inside for 2 consecutive 30min periods it has 80% chance of filling VA (like a gap).
There are several versions: Free, Free Pro, Free MAX. This is the Free Pro version. The Differences are listed below:
- Free: 30 levels, Buy/Sell/Total Volume Profile views, POC
- Free Pro: 25 levels, +Developing POC, Value Area/VWAP High/Low Levels, Above/Below Area Dimming
- Free MAX: 50 levels, packed to the limit
Features:
- Volume Profile with up to 25 levels (3 implementations)
- POC, Developing POC Levels
- Buy/Sell/Total/Side by Side View modes
- Side Cover
- Value Area, VAH/VAL dynamic levels
- VWAP High/Low dynamic levels with Source, Length, StdDev as params
- Show/Hide all levels
- Dim Non Value Area Zones
- Custom Range with Highlighting
- 3 Anchor points for Volume Profile
- Flip Levels Horizontally
- Adjustable width, offset and spacing of levels
- Custom Color for POC/VA/VWAP levels and Transparency for buy/sell levels
Usage:
- specify max_level/min_level for a range (required in ver 1.0/2.0, auto/optional in ver 3.0 = set to highest/lowest)
- select range (start_bar, range length), confirm with range highlighting
- select mode Value Area or VWAP to show corresponding levels.
- flip/select anchor point to position the buy/sell levels, adjust width and spacing as needed
- select Buy/Sell/Total/Side by Side view mode
- use POC/Developing POC/VA/VWAP High/Low as S/R levels. Usually daily values from 1-3 days back are used as levels for the current day.
- Green - buy volume of a specific price level in a range, Red - sell volume. Green + Red = Total volume of a price level in a range
There's no native support for vertical histograms in Pinescript (with price axis as base)
Basically, there are 4 ways to plot a series of horizontal bars stacked on top of each other:
1. plotshape style labeldown (ver 0 prototype discarded)
- you can have a set of fixed width/height text labels consisting of a series of underscores and moving dynamically as levels. Level offset controls visible length.
- you can move levels and scale the base width of the volume profile histogram dynamically
- you can calculate the highest/lowest range values automatically. max_level/min_level inputs are optional
- you can't fill the gaps between levels/adjust/extend width, height - this results in a half baked volume profile and looks ugly
- fixed text level height doesn't adjust and looks bad on a log scale
- fixed font width also doesn't scale and can't be properly aligned with bars when zooming
2. plot style columns + hist_base (ver 1.0)
- you can plot long horizontal bars using a series of small adjacent vertical columns with level offsets controlling visible length.
- you can't hide/move levels of the volume profile histogram dynamically on each bar, they must be plotted at all times regardless - you can't delete the history of a plot.
- you can't scale the base width of the volume profile histogram dynamically, can't set show_last from input, must use a preset fixed width for each level
- hist_base can only be a static const expression, can't be assigned highest/lowest range values automatically - you have to specify max_level/min_level manually from input
- you can't control spacing between columns - there's an equalizer bar effect when you zoom in, and solid bars when you zoom out
- using hist_base for levels results in ugly load/redraw times - give it 3-5 sec to finalize its shape after each UI param change
- level top can be properly aligned with another level's bottom producing a clean good looking histogram
- columns are properly aligned with bars automatically
3. plot style histogram + hist_base (ver 2.0)
- you can plot long horizontal bars using a series of small vertical bars (horizontal histogram) instead of columns.
- you can control the width of each histogram bar comprising a level (spacing/horiz density). Large enough width will cause bar overlapping and give level a "solid" look regardless of zoom
- you can only set width <= 4 in UI Style - custom textbox input is provided for larger values. You can set width and plot transparency from input
- this method still uses hist_base and inherits other limitations of ver 2.0
4. plot style lines (ver 3.0)
- you can also plot long horizontal bars using lines with level offsets controlling visible length.
- lines don't need hist_base - fast and smooth redraw times
- you can calculate the highest/lowest range values automatically. max_level/min_level inputs are optional
- level top can't be properly aligned with another level's bottom and have a proper spacing because line width uses its own units and doesn't scale
- fixed line width of a level (vertical thickness) doesn't scale and looks bad on log (level overlapping)
- you can only set width <= 4 in UI Style, a custom textbox input is provided for larger values. You can set width and plot transparency from input
Notes:
- hist_base for levels results in ugly load/redraw times - give it 3-5 sec to finalize its shape after each UI param change
- indicator is slow on TFs with long history 10000+ bars
- Volume Profile/Value Area are calculated for a given range and updated on each bar. Each level has a fixed width. Offsets control visible level parts. Side Cover hides the invisible parts.
- Custom Color for POC/VA/VWAP levels - UI Style color/transparency can only change shape's color and doesn't affect textcolor, hence this additional option
- Custom Widh for levels - UI Style supports only width <= 4, hence this additional option
- POC is visible in both modes. In VWAP mode Developing POC becomes VWAP, VA High and Low => VWAP High and Low correspondingly to minimize the number of plot outputs
- You can't change buy/sell level colors (only plot transparency) - this requires 2x plot outputs exceeding max 64 limit. That's why 2 additional plots are used to dim the non Value Area zones
- Use Side by Side view to compare buy and sell volumes between each other: base width = max(total_buy_vol, total_sell_vol)
- All buy/sell volume lengths are calculated as % of a fixed base width = 100 bars (100%). You can't set show_last from input
- Sell Offset is calculated relative to Buy Offset to stack/extend sell on top of buy. Buy Offset = Zero - Buy Length. Sell Offset = Buy Offset - Sell Length = Zero - Buy Length - Sell Length
- If you see "loop too long error" - change some values in UI and it will recalculate - no need to refresh the chart
- There's no such thing as buy/sell volume, there's just volume, but for the purposes of the Volume Profile method, assume: bull candle = buy volume, bear candle = sell volume
- Volume Profile Range is limited to 5000 bars for free accounts
P.S. Cantaloupia Will be Free!
Links on Volume Profile and Value Area calculation and usage:
www.tradingview.com
stockcharts.com
onlinelibrary.wiley.com

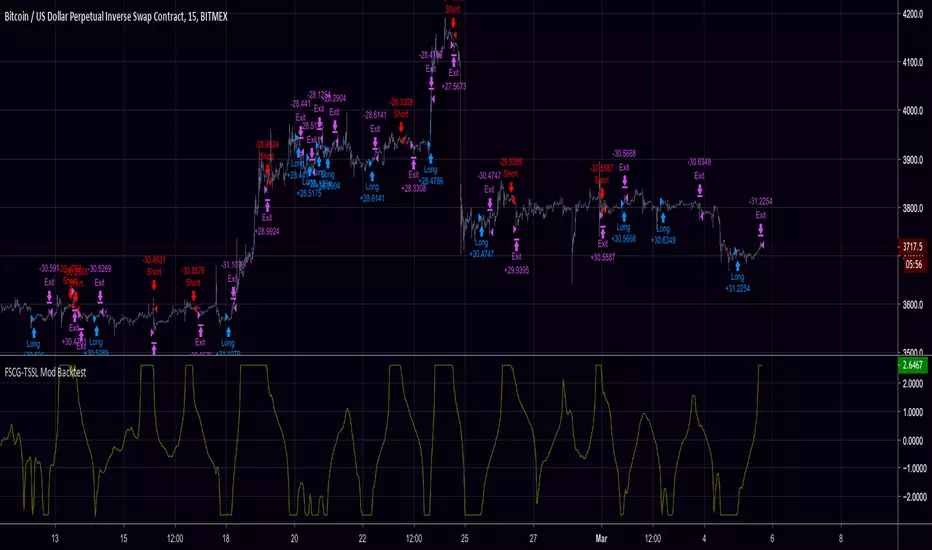
FSCG-TSSLA modification of dasanc's "Fisher Stochastic Center of Gravity"
Added:
- Thresholds for Buy/Sell Signals
- Trailing Stop / Stop Loss
- Backtest Range
Support the open-source community.
Screw you people selling open-source scripts to newbies.
Tip Jar: 3KNZq8mE24MuBmpDJVF31bBy8zc9beDiZo
Contact me for collaborations and let's take things to the next level!
Do NOT contact me for alert scripts or paid-custom work, I don't work for clients.
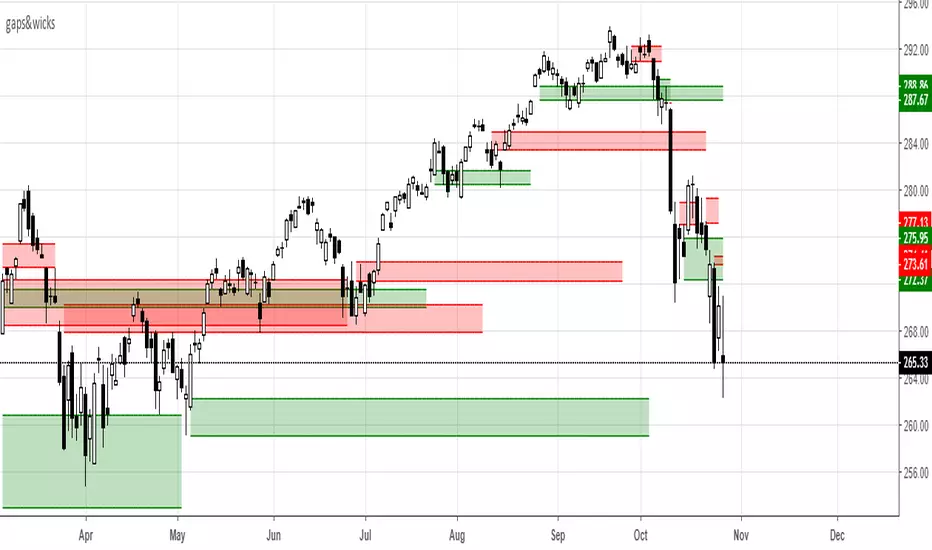
gaps&wicksA means for tracking price ranges for gap up/down and longer buying/selling tails. This may have some value for buying/selling opportunities based on the relative significance of the range. The look back period is adjustable and works for any time frame. If you have any success using it leave some feedback.
-Squam
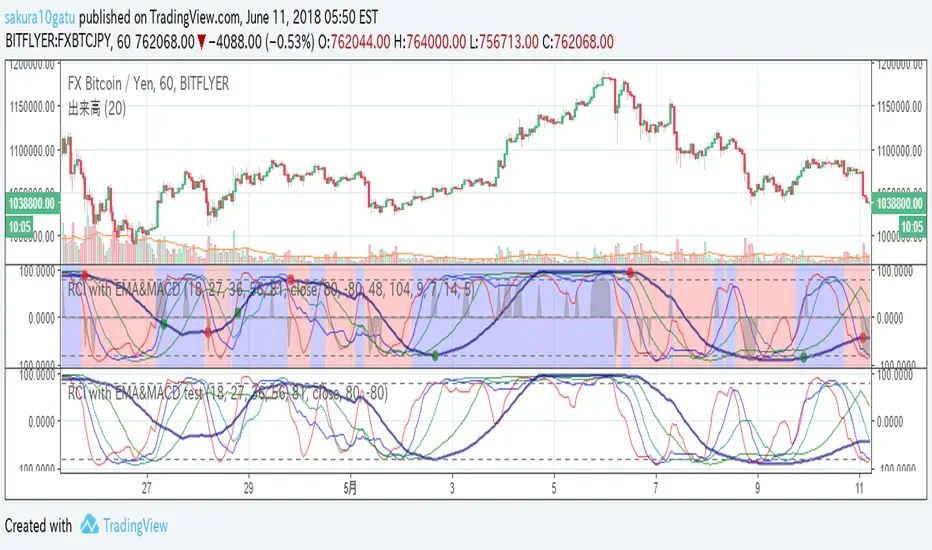
RCI with EMA&MACD2018/6/11 Re-release for house rule of Trading view.
5lines : RCI lines. A thick navy line has the longest period.
circles : MACD cross. GC=green DC=red
backcolor : Short EMA > Long EMA is blue. Short EMA < Long EMA is red.
Black shadow : It reveals its appearance when over-buying/selling.
It helps your entry.
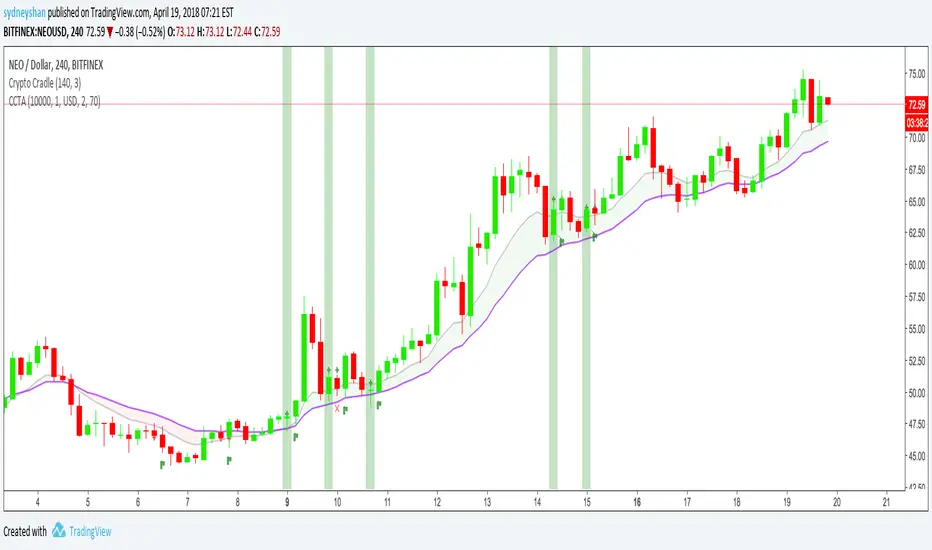
Crypto Cradle Trade AssistantThis indicator compliments the Crypto Cradle indicator by providing your entry, stop, 1:1 scale-out price, trade amount, and potential profit based on your target and scale-out strategy.
1. Ensure you have added the Crypto Cradle and Crypto Cradle Trade Assistant indicators to your chart
2. Click the cog icon to configure this indicator
3. Enter in your account balance and the % you are willing to risk on this trade (default: 1%).
3. Set your target price
4. Tweak the Trade Pair and Precision (Decimals) if required (USD/USDT only BTC & ETH coming soon)
5. Click on the 'Data Window' icon on the right-hand side of the screen and scroll down to CCTA
6. Hover over a highlighted crypto cradle candle (green for long, red for short) and a series of values will appear
Entry price
Stop price
1:1 scale out price
Amount to buy/sell (ie NEO)
Amount in traded currency (ie USD)
Target price (that you set)
Profit based on selling 50% of your bought amount when your reward equals your risk (1:1 scale-out)
Profit based on risking 1% of your portfolio
For more about the Crypto Cradle strategy, visit www.tradercobb.com

Volume Based Price ActionThis indicator is uses volume and common candlestick patterns to suggest potential trend reversals. It is not quite meant to be used as a buy/sell signal. Instead, it should be used to evaluate market psychology based on when the buyers or sellers fully dominated the price action.
In the current version, the indicators looks for engulfing and pin-bar patterns. Optionally, it also considers rising volume as further confirmation to the signal. In future, I plan on allowing it to track more candlestick patterns.
Please let me know if you have any suggestions, concerns, or comments!

Candlestick Trend Indicator v0.5 by JustUncleLRequested Update to this Indicator alert project. In this update I have added the option to be able select which Price Action candles you want included in the display and the generated alarm Alert. Other changes also included in this update:
Also added a Price Action candle for "Last Fractal S/R Break", this also a good continuation indication.
Added option to select a different moving average types for directional MA line.
Modified some default settings, using HullMA instead of Zero Lag EMA and standard MACD settings(12,26,9).
Description:
This is a trend following indicator and alert for Binary Options based on Candlestick patterns and trend line -
NOTE: original system was a forex trading system.
This code combines a number of indicators to create an overall trading strategy.
The indicator recognises and displays some useful candle named defined patterns that are used to support trend continuation:
Bearish + Bullish PinBars
Dark Cloud Cover
Piecing Line
Bullish + Bearish Harami
Bullish + Bearish Engulfing Candle
Bullish + Bearish Last Fractal S/R break
Also recognises main Price Action candles from ChrisMoody (CM), the four(4) price action patterns are colored coded bars:
Yellow = Inside Bar - breakout/continuance
Orange = Outside Bar - breakout/continuance
Aqua/Fuschia = Up/Down Shaved Bars - Buying/Selling pressure
Red/Green = Possible reversal PinBars - Reverse Down / reverse Up
The highlighted candles (maroon and darker green) represent the defined PA patterns that have been confirmed following the current trend direction that is indicated by the Hull MA(20) line (can select a different type of MA, or even disable) and confirmed by MACD direction (can be disabled). The confirmed Alerts are indication by green (buy) and red (sell) dots at the bottom of the chart. An alert is generated from this selection for the alert condition of the alarming system.
The fractal upper/lower break lines are also draw, if the (optional) last fractal break line is broken by a highlighted bar then this indicates a stronger trend conformation.
The MACD indicator MACD DEUTER 2 colour(12,26,9) you can visually see the MACD histogram colours with MACD direction - needs "MACD DEUTER 2 colour" indicator.
This multi-indicator set up is suitable for 1hr, 4hr and daily charts with 1-4 candle expiry.
References and Inspiration from:
Fractal Levels by RicardoSantos
Almost Zero Lag EMA
Candlestick Patterns With EMA by rmwaddelljr
CM_Price-Action-Bars by ChrisMoody
www.forexstrategiesresources.com
"Scalp Jockey - MTF MA Cross Visual Strategizer by JayRogers"

QQE Cross Indicator Alert v2.0 by JustUncleLThis version of the indicator makes a distinction between the types of QQE cross alerts on the chart and now only recommends the Thresh Hold channel exit crosses for BUY/SELL alerts, the other two types of crosses are still there to provide pre-warning of pending BUY/SELL alerts. Also only the BUY/SELL alerts are filtered by Moving Average Filter and/or the new Directional filter (default). The default settings in this version have also been changed, particularly the Moving Averages, to indicate trend changes quicker.
Indicator Project Description:
*** This is a trend following indicator alert that uses fast QQE crosses with Moving Averages for trend direction filtering. QQE or Qualitative Quantitative Estimation is based on the relative strength index, but uses a smoothing technique as an additional transformation. Three crosses can be selected (all selected by default):
RSI signal crossing ZERO (XZERO)
RSI signal crossing Fast RSIatr line (XQQE)
RSI signal exiting the RSI Threshhold Channel (BUY/SELL)
The (BUY/SELL) alerts can be optionally filtered by the Moving Average Combo:
For BUY alert the Close must be above the fast MA and
fast MA (EMA8) > medium MA (EMA20) > slow MA (SMA50).
For SELL alert the Close must be below the fast MA and
fast MA (EMA8) < medium MA (EMA20) < slow MA (SMA50).
and/or Directional filter (default filter):
For BUY alert the Close must be above the slow MA (SMA50) and the directional MA (EMA20) must be green.
For SELL alert the Close must be below the slow MA (SMA50) and the directional MA (EMA20) must be red.
The XZERO and XQQE are not included in the filtering, they are used to indicate pending BUY/SELL alerts, particularly the XZERO.
Note: I have found the XQQE cross can also be quite good alert for BUY/SELL as well, particularly in direction of current trend. The XZERO I have found to be totally unreliable for BUY/SELL alerts.
This indicator should work on any currency pair, most chart timeframes and expiry in 3 to 6 candles for binary option trading. For hourly or longer charts expiry can be longer for binary options, or if available use standard forex trading techniques
Some Hints for using this indicator:
Avoid taking trades in non-trending market, this is normally indicated by a near Horizontal SMA50 line.
Avoid trading when all the moving averages are close together.
When trading 1min and 5min charts, expiry should set to 1-3 candles.
Avoid trading when market choppy, this is normally indicated by the fast EMA8 crossing the EMA20 back and forwards quickly.
High probability trades tend to occur when you get a XQQE followed by a XZERO and then BUY/SELL in the same direction of trend.
Don't trade near nor directly on any major market news (sometime better no trade day).
Please practise this system in DEMO first, before committing any real money. Be patient the more you practise the better and more confident you will be.
I hope you enjoy this indicator, it has proven very effective for me.

ZTLs Bar_TrendHere is an adaptation of TTM_Trend I coded. It's all pretty self explanatory. Aqua = buy and red = sell.
There's only one setting to tweak and it's the look-back for highest and lowest.
I have found that this indicator gives signals at almost identical areas to the TTM_Trend but tend to actually be a little more efficient (earlier buy/sell signals), although I haven't thoroughly back-tested it.
Enjoy!
Please comment below if you have any questions.

MACD (Buy & Sell signals)This file uses the original code of the MACD and adds a Buy Sell signal when the MACD cuts the signal
ADX Buy/Sell Markers (on ADX pane)This TradingView indicator is designed to help traders identify buy and sell opportunities using the Average Directional Index (ADX) combined with directional indicators (+DI and -DI). It works by plotting the ADX line and detecting when the +DI line crosses above or below the -DI line, signaling potential changes in market direction. The indicator only triggers a buy or sell signal if the ADX value is above a certain threshold, ensuring that signals are only generated during stronger trends. By combining these elements, the indicator helps traders filter out weaker signals and focus on higher-probability trading opportunities, making it an important tool for trend-following strategies CME_MINI:NQ1!

JW Clean Adaptive Channel//@version=5
indicator("JW Clean Adaptive Channel", overlay=true)
// Inputs
emaFast = input.int(20, "EMA Fast")
emaMid = input.int(50, "EMA Mid")
emaSlow = input.int(200, "EMA Slow")
atrLen = input.int(14, "ATR Length")
regLen = input.int(100, "Regression Window")
multATR = input.float(2.0, "Channel Width x ATR", step=0.1)
baseATR = input.int(50, "ATR Baseline")
volCap = input.float(2.5, "Max Vol Mult", step=0.1)
// EMAs
ema20 = ta.ema(close, emaFast)
ema50 = ta.ema(close, emaMid)
ema200 = ta.ema(close, emaSlow)
plot(ema20, "EMA 20", color=color.lime)
plot(ema50, "EMA 50", color=color.yellow)
plot(ema200, "EMA 200", color=color.orange, linewidth=2)
// Adaptive regression channel
atr = ta.atr(atrLen)
bAtr = ta.sma(atr, baseATR)
vRat = bAtr == 0.0 ? 1.0 : math.min(atr / bAtr, volCap)
width = atr * multATR * vRat
basis = ta.linreg(close, regLen, 0)
upper = basis + width
lower = basis - width
slope = basis - basis
chanColor = slope > 0 ? color.lime : slope < 0 ? color.red : color.gray
pU = plot(upper, "Upper", color=chanColor)
pL = plot(lower, "Lower", color=chanColor)
pB = plot(basis, "Basis", color=color.gray)
fill(pU, pL, color=color.new(chanColor, 85))
// Candle and background color
ribbonBull = ema20 > ema50 and ema50 > ema200
ribbonBear = ema20 < ema50 and ema50 < ema200
barcolor(ribbonBull ? color.lime : ribbonBear ? color.red : na)
bgcolor(slope > 0 ? color.new(color.green, 85) : slope < 0 ? color.new(color.red, 85) : na)
// MACD buy/sell markers
= ta.macd(close, 12, 26, 9)
buySig = ta.crossover(macdLine, sigLine) and slope > 0
sellSig = ta.crossunder(macdLine, sigLine) and slope < 0
plotshape(buySig, title="Buy", style=shape.triangleup, color=color.lime, location=location.belowbar, size=size.tiny)
plotshape(sellSig, title="Sell", style=shape.triangledown, color=color.red, location=location.abovebar, size=size.tiny)
// Trend strength label (single-line calls; no dangling commas)
strength = slope * vRat * 1000.0
string tText = "Sideways"
color tCol = color.gray
if strength > 2
tText := "Strong Uptrend"
tCol := color.lime
else if strength > 0.5
tText := "Weak Uptrend"
tCol := color.new(color.lime, 40)
else if strength < -2
tText := "Strong Downtrend"
tCol := color.red
else if strength < -0.5
tText := "Weak Downtrend"
tCol := color.new(color.red, 40)
var label tLbl = na
if barstate.islast
if not na(tLbl)
label.delete(tLbl)
tLbl := label.new(x=bar_index, y=high, text=tText, style=label.style_label_right, textcolor=color.white, color=tCol, size=size.normal, yloc=yloc.price)
// 10-day breakout alerts
hi10 = ta.highest(high, 10)
lo10 = ta.lowest(low, 10)
alertcondition(close > hi10, title="10-Day High Break", message="{{ticker}} 10D HIGH @ {{close}}")
alertcondition(close < lo10, title="10-Day Low Break", message="{{ticker}} 10D LOW @ {{close}}")
alertcondition(buySig, title="Buy Alert", message="BUY {{ticker}} @ {{close}}")
alertcondition(sellSig, title="Sell Alert", message="SELL {{ticker}} @ {{close}}")

London Breakout Structure by Ale📈 London Breakout Structure by Ale
This indicator identifies market structure breakouts (CHOCH/BOS) within a specific London session window, highlighting potential breakout trades with automatic entry, stop loss (SL), and take profit (TP) levels.
It helps traders focus on high-probability breakouts when volatility increases after the Asian session, using price structure, ATR-based volatility filters, and a custom risk/reward setup.
🔹 Example of Strategy Application
Define your session (e.g. 04:00 to 05:00).
Wait for a CHOCH (Change of Character) inside this session.
If a bullish CHOCH occurs → go LONG at candle close.
If a bearish CHOCH occurs → go SHORT at candle close.
SL is set below/above the previous swing using ATR × multiplier.
TP is calculated automatically based on your R:R ratio.
📊 Example:
When price breaks above the last swing high within the session, a “BUY” label appears and the indicator draws Entry, SL, and TP levels automatically.
If the breakout fails and price closes below the opposite structure, a “SELL” signal will replace the bullish setup.
🔹 Details
The logic is based on structural shifts (CHOCH/BOS):
A CHOCH occurs when price breaks and closes beyond the most recent high/low.
The indicator dynamically detects these shifts in structure, validating them only inside your chosen time window (e.g. the London Open).
The ATR filter ensures setups are valid only when the range has enough volatility, avoiding false signals in low-volume hours.
You can also visualize:
The session area (purple background)
Entry, Stop Loss, and Take Profit levels
Direction labels (BUY/SELL)
ATR line for volatility context
🔹 Configuration
Start / End Hour: define your preferred trading window.
ATR Length & Multiplier: adjust for volatility.
Risk/Reward Ratio: set your desired R:R (default 1:2).
Minimum Range Filter: avoids signals with tight SLs.
Alerts: receive notifications when breakout conditions occur.
🔹 Recommendations
Works best on 15m or 5m charts during London session.
Designed for breakout and structure-based traders.
Works on Forex, Crypto, and Indices.
Ideal as a visual and educational tool for understanding BOS/CHOCH behavior.

Luxy UT BOT Watchlist ScannerUT BOT Watchlist Scanner - User Guide
Version: 1.0
Overview
The Luxy UT BOT Watchlist Scanner is a multi-symbol monitoring tool that combines the UT Bot (Ultimate Trailing Stop) algorithm with real-time scanning capabilities. It allows traders to monitor up to 10 symbols simultaneously for trend reversals based on ATR trailing stops, without needing to manually switch between charts.
What is UT Bot?
UT Bot is a trend-following indicator that uses ATR (Average True Range) to create a dynamic trailing stop. When price crosses above the trailing line, it signals a potential uptrend (BUY). When price crosses below, it signals a potential downtrend (SELL).
Key Features
Real-Time Multi-Symbol Scanning
Monitor up to 10 symbols for UT Bot signals without switching charts. The scanner checks each symbol on your selected timeframe and displays recent flips in a table.
Customizable Timeframe
Scan symbols on any timeframe (1m to Daily) independently of your current chart timeframe. This allows you to trade on 5-minute charts while monitoring 1-hour signals across multiple symbols.
TTL (Time-To-Live) Management
Symbols appear in the table only when they flip and remain visible for a configurable duration (default: 5 minutes). This prevents clutter and focuses attention on recent opportunities.
Real-Time Alerts
Receive TradingView alerts when any monitored symbol flips. Optional daily throttling prevents alert spam on volatile tickers.
On-Chart UT Visualization
Display the UT trailing stop line and buy/sell labels directly on your current chart for manual analysis.
Who Is This For?
Day Traders
Scan multiple stocks or forex pairs for breakout signals without missing opportunities on other charts.
Swing Traders
Monitor a portfolio of assets on higher timeframes (4H, Daily) to catch major trend reversals.
Multi-Asset Traders
Track symbols across different sectors or asset classes simultaneously (stocks, crypto, forex).
Alert-Based Traders
Set up alerts and step away from the screen. Get notified only when your monitored symbols generate signals.
Advantages Over Similar Indicators
Versus Manual Chart Switching
Eliminates the need to cycle through multiple charts manually. All signals appear in one consolidated table.
Versus Single-Symbol UT Bot
Standard UT Bot indicators only work on the current chart. This scanner extends the functionality to 10 symbols at once.
Versus Screeners
Most screeners require premium subscriptions and operate outside TradingView. This tool works entirely within your existing TradingView setup.
Performance Optimized
Smart scanning logic reduces unnecessary calculations. The scanner only processes data when the target timeframe bar is confirmed, minimizing CPU load.
How To Use
Step 1: Add To Chart
Open any chart in TradingView
Click "Indicators" and search for "Luxy UT BOT Watchlist Scanner"
Add the indicator to your chart
Step 2: Configure UT Bot Settings
Sensitivity (Key × ATR)
Controls how tight or loose the trailing stop follows price.
Recommended starting points:
Scalping (1-5m charts): 0.9 - 1.2
Day Trading (5-60m charts): 1.3 - 2.2
Swing Trading (4H-D charts): 1.7 - 3.0
Lower values = more signals, faster reactions, higher noise
Higher values = fewer signals, stronger trends, less noise
ATR Period
Number of bars for volatility calculation.
Recommended starting points:
Scalping: 5-7 bars
Day Trading: 7-14 bars
Swing Trading: 10-21 bars
Shorter periods = more responsive to recent volatility
Longer periods = smoother, less reactive to noise
Step 3: Configure Watchlist Scanner
Symbols to Scan
Enter up to 10 symbols separated by commas.
Example: AAPL, MSFT, NVDA, TSLA, AMZN
For stocks, use the ticker symbol only (not exchange prefix).
For crypto, use the full pair name (BTCUSD, ETHUSD).
For forex, use standard pairs (EURUSD, GBPUSD).
Scanner Timeframe
Select the timeframe for signal detection across all symbols.
Recommended combinations:
Chart: 5m, Scanner: 15m (day trading with confirmation)
Chart: 15m, Scanner: 1H (swing trading setup)
Chart: 1H, Scanner: 4H (position trading)
The scanner timeframe can differ from your chart timeframe. This is useful for multi-timeframe analysis.
Keep Hits For (TTL)
How long symbols remain visible in the table after a flip.
Recommended settings:
Active monitoring: 5-10 minutes
Passive monitoring: 15-30 minutes
Symbols that flip again within the TTL window reset the timer.
Step 4: Set Up Alerts (Optional)
To receive notifications when any symbol flips:
Enable "Enable Runtime Alerts" in the scanner settings
Click the TradingView alert button (clock icon)
Set condition to: "Any alert() function call"
Configure your notification preferences (popup, email, webhook)
Click "Create"
Optional: One Alert Per Symbol Per Day
Enable this to limit alerts to once per calendar day per symbol. Useful for volatile tickers that flip multiple times.
Recommended Settings By Trading Style
Scalping (1-5 minute charts)
Sensitivity: 1.0
ATR Period: 5
Scanner Timeframe: 3m or 5m
TTL: 5 minutes
Best for: High-frequency traders monitoring liquid assets
Day Trading (5-60 minute charts)
Sensitivity: 1.5
ATR Period: 10
Scanner Timeframe: 15m or 30m
TTL: 10 minutes
Best for: Intraday swing trades with moderate position holding
Swing Trading (4H-Daily charts)
Sensitivity: 2.2
ATR Period: 14
Scanner Timeframe: 4H or D
TTL: 30 minutes
Best for: Multi-day positions and trend following
Conservative Approach (Low Noise)
Sensitivity: 3.0
ATR Period: 21
Scanner Timeframe: D
TTL: 30 minutes
Best for: Long-term investors wanting only strong trend changes
Note: These are configuration suggestions, not trading advice. Always test settings on historical data and adjust based on the asset's volatility and your risk tolerance.
Understanding The Table
The watchlist table appears at your selected position (default: bottom left) and displays:
SYMBOL column: Ticker symbol that flipped
SIGNAL column: BUY (green) or SELL (red)
Symbols are sorted with the most recent flip at the bottom.
The table updates in real-time as symbols are scanned. If no symbols are currently active, the table will be empty or show only the header.
Performance Notes
How The Scanner Works
The scanner processes symbols in batches to minimize load. Each bar, it scans up to 10 symbols and checks for signal changes.
The smart timing optimization ensures scanning only occurs when the target timeframe bar is confirmed, reducing unnecessary calculations by approximately 70 percent.
Symbol Limit
The maximum is 10 symbols to maintain performance. If you need to monitor more symbols, you can add the indicator multiple times with different symbol lists.
Calculation Bars
The scanner uses 300 historical bars for accurate signal detection. This ensures proper ATR calculation even when scanning symbols different from your current chart.
Troubleshooting
Table not showing any symbols
Verify symbols are entered correctly (no extra spaces)
Check that symbols are valid for your TradingView plan
Ensure "Show Watchlist Table" is enabled
Wait for at least one symbol to generate a signal
Alerts not triggering
Confirm "Enable Runtime Alerts" is on
Verify you created an alert with condition "Any alert() function call"
Check that you're viewing the chart in real-time (not replay mode)
Invalid symbol errors
Remove any exchange prefixes (use AAPL, not NASDAQ:AAPL)
For crypto, ensure you're using the correct pair format for your exchange
Some symbols may require premium data access
Too many or too few signals
Adjust the Sensitivity value (lower = more signals, higher = fewer signals)
Try a different ATR Period
Consider changing the scanner timeframe
Important Disclaimers
This indicator is a technical analysis tool only. It does not predict future price movements or guarantee trading profits.
All suggested settings are for educational purposes and should be tested in a demo environment before live trading.
The UT Bot algorithm generates signals based on historical price data and volatility. Like all technical indicators, it can produce false signals, especially in choppy or ranging markets.
Always use proper risk management, position sizing, and additional confirmation methods when making trading decisions.
Past performance of any trading strategy or methodology is not indicative of future results.

Session Volume Spike DetectorSession Volume Spike Detector (Buy/Sell, Dual Windows, MTF + Edge/Cooldown)
What it does
Detects statistically significant buy/sell volume spikes inside two DST-aware Mountain Time sessions and projects 1m / 5m / 10m signals onto any chart timeframe (even 1s). Spikes are confirmed at the close of their native bar and are edge-triggered with optional cooldowns to prevent duplicate alerts.
How spikes are detected
Volume ≥ SMA × multiplier
Optional jump vs recent highest volume
Optional Z-Score gate for significance
Separate Buy/Sell logic using your Direction Mode (Prev Close or Candle Body)
Multi-Timeframe (MTF) display
Shows 1m, 5m, 10m arrows on your current chart
Each HTF fires once on its bar close (no repaint after close)
Sessions (DST-aware, MT)
Morning: 05:30–08:30
Midday: 11:00–13:30
Spikes only count inside these windows.
Inputs & styling
Thresholds: SMA length, multipliers, recent lookback, Z-Score toggle/level
Toggles for which TFs to display (chart TF, 1m, 5m, 10m)
Per-TF colors + cooldowns (seconds) for Any TF, 1m, 5m, 10m
Alerts (edge + cooldown)
MTF Volume Spike (Any TF) — fires on the first qualifying spike across enabled TFs
1m / 5m / 10m Volume Spike — per-TF alerts, Buy or Sell
Recommended: set alert Trigger = Once per bar close. Cooldowns tame “triggered too often” warnings.
Great with
FVG zones, bank/insto levels, session range breaks, and trend filters. Use the MTF arrows as a participation/pressure tell to confirm or fade moves.
Notes
Works on any symbol/timeframe; best viewed on 1m or sub-minute charts.
HTF spikes appear on the bar close of 1m/5m/10m respectively.
No dynamic plot titles; Pine v6-safe.
Short summary (≤250 chars):
MTF volume-spike detector for intraday sessions (DST-aware, MT). Projects 1m/5m/10m buy/sell spikes onto any chart, with edge-triggered alerts and per-TF cooldowns to prevent duplicates. Ideal for spotting institutional participation.

TokMaz – Signal Plain🧭 Overview
A clean, lightweight, and non-repainting directional signal indicator built for serious traders.
This version is fully optimized and locked to ensure stable performance and consistent signal output.
⚙️ Features
1. Designed to follow price precisely (no delay or offset).
2. Non-repainting structure — all signals confirmed on bar close.
3. Automatic Buy/Sell/Rejection alerts ready for webhook or automation use.
4. Minimal visual design — clear lines, direct chart attachment, no background clutter.
5. Integrated trend reference line (SMA200) for long-term view.
💡 Signal Display:-
🔵 BUY Solid – Bullish directional setup
🔴 SELL Solid – Bearish directional setup
⚪ REJ→BUY / REJ→SELL – Potential rejection or reversal zones
All signals appear directly on candles for instant readability and execution timing.
📢 Alerts:-
✅ BUY Solid
✅ SELL Solid
⚡ REJ→BUY
⚡ REJ→SELL
Works seamlessly with TradingView notifications or external automation.
📈 Style:-
EMA50 (dynamic price reference)
SMA200 (trend backbone)
Clean, professional visual — perfect for live trading or educational setups.

Katana_Fox RSI Pro - Advanced Momentum Indicator with Clear BUOverview:
Connors RSI Pro is a sophisticated enhancement of the classic Connors RSI indicator, designed for traders who demand professional-grade tools. This premium version combines multiple momentum components with intelligent signaling and beautiful visualization to give you an edge in the markets.
Key Features:
🎯 Clear BUY/SELL Signal System
BUY signals in green when CRSI crosses above oversold level
SELL signals in red when CRSI crosses below overbought level
Clean, professional labels that are easy to read
Customizable overbought/oversold levels (70/30 default)
🎨 Professional Visualization
Modern color scheme that adapts to market conditions
Customizable background fills for better readability
Smooth, easy-to-read line plotting
⚡ Enhanced Calculations
Triple-component momentum analysis (RSI, UpDown RSI, Percent Rank)
EMA smoothing for reduced noise and false signals
Configurable lengths for each component
🔔 Advanced Alert System
4 distinct alert conditions for various market scenarios
Compatible with TradingView's native alert system
Perfect for automated trading strategies
Input Parameters:
RSI Length (3): Period for standard RSI calculation
UpDown Length (2): Period for UpDown RSI component
ROC Length (100): Period for Rate of Change percentile ranking
Signal Alerts: Toggle BUY/SELL signals on/off
Custom Colors: Choose between classic and modern color schemes
Trading Signals:
BUY (Green Label): Bullish signal when CRSI crosses above oversold level
SELL (Red Label): Bearish signal when CRSI crosses below overbought level
Background Colors: Visual zones indicating momentum strength
Ideal For:
Swing traders seeking momentum reversals
Day traders looking for overbought/oversold conditions
Algorithmic traders needing reliable signals
Technical analysts wanting multi-timeframe confirmation
How to Use:
Oversold Bounce: Enter long when CRSI shows BUY signal above 30
Overbought Rejection: Enter short when CRSI shows SELL signal below 70
Trend Confirmation: Use the 50-level crossover for trend direction
Divergence Trading: Look for price/indicator divergences at extremes
Upgrade your trading arsenal with Connors RSI Pro - where professional analytics meet clear trading signals!

TGFA Flexible Alerts Multi-MA CrossoversTGFA Flexible Alerts, Multi-MA Crossovers
Description
Flexible MA crossovers with BUY/SELL alerts, customizable candle colors, and an info box for ATR/volatility insights. Supports EMA/SMA/HMA/VWAP on any chart.
Overview
TGFA Flexible Alerts is a versatile Pine Script indicator for traders seeking customizable moving average (MA) crossovers, visual signals, and quick-reference metrics. It overlays crossover lines (e.g., fast EMA over slow SMA), generates BUY/SELL labels and alerts, colors candles based on themes, and includes an optional info box with ATR bands, support/resistance, and trend projections. Built for any symbol and timeframe (optimized for 1H intraday), it auto-detects Heikin Ashi charts and handles mixed MA types like responsive HMA with lagging EMAs. All logic uses built-in TA functions for reliability—no repainting on confirmed bars.
Key Features
MA Crossover Engine: Configurable lines (EMA, SMA, HMA, VWAP) with dynamic colors (HMA tints green/red based on slope). Enable/disable via inputs.
Invert Signals Toggle: Flips BUY/SELL logic for mixed MA setups (e.g., HMA as fast line over EMA).
Reasoning: Traditional crossovers assume a fast line (low lag) crossing above a slow line (high lag) for buys. HMA's hull design makes it ultra-responsive, so it may "lead" too aggressively—causing premature signals. Inverting aligns it with user intuition (e.g., HMA dipping below then recovering signals strength), reducing false positives in trending markets. Test on your pairs!
Visual Alerts: BUY/SELL labels at crossover price (with optional price display and offset adjustment).
Single MA Overlays: Independent plots for EMA/SMA/HMA/VWAP (length 0 to hide).
Info Box: Real-time table with current price, ±1/2 ATR bands, median price (over lookback), trend (SMA50 slope), volatility % (ATR normalized), support/resistance (recent highs/lows), and reversal projections (tied to SMA50 pivot for up/down bias).
Candle Coloring: 20+ themes (dark/light canvases) for bull/bear/reversal/low-volume bars—e.g., Emerald Blaze greens uptrends, dims on low vol. Toggle off for no changes.
Chart Source Flexibility: Auto-switches to Heikin Ashi if detected; manual override for Regular/HA.
Alerts fire on crossovers/crossunders (custom messages with ticker/interval). Open-source for forking.
How to Use
Add to Chart: Search in TradingView's public library, apply to any symbol (e.g., stocks, forex). Best on 1H for intraday, but works on daily/weekly too.
Setup Crossovers: Choose Line 1/2 types/lengths (e.g., HMA 9 over SMA 20). Enable "Invert Signals" if using HMA—prevents lag mismatches in volatile assets.
Alerts & Labels: Toggle labels for visuals; set TradingView alerts on "Buy"/"Sell" conditions. Use offset for crowded charts.
Info Box Insights: Enable for quick scans—e.g., enter long near support if trend is bullish and price > median. Adjust ATR length (default 14) for sensitivity.
Candle Themes: Pick a scheme (e.g., Neon Pulse for dark mode); it overrides bar colors without altering data.
Customization Tip: For HMA-heavy setups, invert + short lengths (5-9) catch turns early; pair with volume filter in alerts.
Limitations & Disclaimers - Designed for overlay on price charts; may overlap in tight ranges—adjust transparency via styles.
HMA can repaint intra-bar; signals confirm on close. Not back tested for all assets—validate with strategy tester.
Info box projections use SMA(50) as a trend pivot (same for up/down as reference); customize via code for advanced calcs. Candle colors are cosmetic only.
This is an analysis tool, not advice. Trading involves risk; combine with fundamentals/news. Past performance isn't indicative of future results. No liability for losses.
I'm still a newbie, so feedback encouraged!
Thank you!!
ThisGirl

Tunç ŞatıroğluTunç Şatıroğlu's Technical Analysis Suite
Description:
This comprehensive Pine Script indicator, inspired by the technical analysis teachings of Tunç Şatıroğlu, integrates six powerful TradingView indicators into a single, user-friendly suite for robust trend, momentum, and divergence analysis. Each component has been carefully selected and enhanced by beytun to improve functionality, performance, and visual clarity, aligning with Şatıroğlu's approach to technical analysis. The default configuration is meticulously set to match the exact settings of the individual indicators as used by Tunç Şatıroğlu in his training, ensuring authenticity and ease of use for followers of his methodology. Whether you're a beginner or an experienced trader, this suite provides a versatile toolkit for analyzing markets across multiple timeframes.
Included Indicators:
1. WaveTrend with Crosses (by LazyBear, modified): A momentum oscillator that identifies overbought/oversold conditions and trend reversals with clear buy/sell signals via crosses and bar color highlights.
2. Kaufman Adaptive Moving Average (KAMA) (by HPotter, modified): A dynamic moving average that adapts to market volatility, offering a smoother trend-following signal.
3. SuperTrend (by Alex Orekhov, modified): A trend-following indicator that plots dynamic support/resistance levels with buy/sell signals and optional wicks for enhanced accuracy.
4. Nadaraya-Watson Envelope (by LuxAlgo, modified): A non-linear envelope that highlights potential reversals with customizable repainting options for smoother outputs.
5. Divergence for Many Indicators v4 (by LonesomeTheBlue, modified): Detects regular and hidden divergences across multiple indicators (MACD, RSI, Stochastic, CCI, Momentum, OBV, VWMA, CMF, MFI, and more) for early reversal signals.
6. Ichimoku Cloud (TradingView built-in, modified): A multi-faceted indicator for trend direction, support/resistance, and momentum, with enhanced visuals for the Kumo Cloud.
Key Features:
- Authentic Default Settings : Pre-configured to mirror the exact parameters used by Tunç Şatıroğlu for each indicator, ensuring alignment with his proven technical analysis approach.
- Customizable Settings : Enable/disable individual indicators and fine-tune parameters to suit your trading style while retaining the option to revert to Şatıroğlu’s defaults.
- Enhanced User Experience : Modifications improve visual clarity, performance, and usability, with options like repainting smoothing for Nadaraya-Watson and adjustable Ichimoku projection periods.
- Multi-Timeframe Analysis : Combines trend-following, momentum, and divergence tools for a holistic view of market dynamics.
- Alert Conditions : Built-in alerts for SuperTrend direction changes, buy/sell signals, and divergence detections to keep you informed.
- Visual Clarity : Overlays (KAMA, SuperTrend, Nadaraya-Watson, Ichimoku) and pane-based indicators (WaveTrend, Divergences) are clearly distinguished, with customizable colors and styles.
Notes:
- The Nadaraya-Watson Envelope and Ichimoku Cloud may repaint in their default modes. Use the "Repainting Smoothing" option for Nadaraya-Watson or adjust Ichimoku settings to mitigate repainting if preferred.
- Published under the MIT License, with components licensed under GPL-3.0 (SuperTrend), CC BY-NC-SA 4.0 (Nadaraya-Watson), MPL 2.0 (Divergence), and TradingView's terms (Ichimoku Cloud).
Usage:
Add this indicator to your TradingView chart to leverage Tunç Şatıroğlu’s exact indicator configurations out of the box. Customize settings as needed to align with your strategy, and use the combined signals to identify trends, reversals, and divergences. Ideal for traders following Şatıroğlu’s methodologies or anyone seeking a powerful, all-in-one technical analysis tool.
Credits:
Original authors: LazyBear, HPotter, Alex Orekhov, LuxAlgo, LonesomeTheBlue, and TradingView.
Modifications and integration by beytun .
License:
Published under the MIT License, incorporating code under GPL-3.0, CC BY-NC-SA 4.0, MPL 2.0, and TradingView’s terms where applicable.
